
CHART: POPclock |
Current Population of the U.S.
Up to the second population estimates. |
Provided by
U.S. Bureau of the Census
as of today.
|
CHART: POPclock |
Current Population of the World
Up to the second population estimates. |
Provided by
U.S. Bureau of the Census
as of today.
|
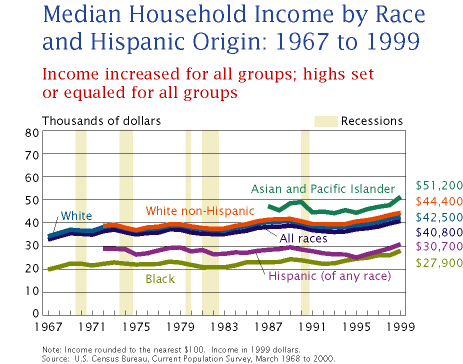
CHART: Median Household Income by Race and Hispanic Origin: 1972 to 1999 |
Household Income
The real median income of households in the United States
rose by 2.7 percent between 1998 and 1999, from $39,744 to
$40,816. This is the fifth consecutive year that household
income increased. Real median household income is now at
the highest level recorded since the Census Bureau started
compiling these estimates in 1967. The 1999 median income
was the highest ever recorded, in real terms, for White
($42,504), non-Hispanic White ($44,366); Black ($27,910);
and Hispanic, who may be of any race ($30,735) households.
Although the real median income of Asian and Pacific Islander
households increased between 1998 and 1999 to $51,205, that
amount was not statistically different from their 1989
recorded high. |
Previous
$39,744
1998
(in 1999 dollars)
|
Current
$40,816
1999
(in 1999 dollars)
|
Provided by
U.S. Bureau of the Census
/
Current Population Survey
as of September 26, 2000.
|
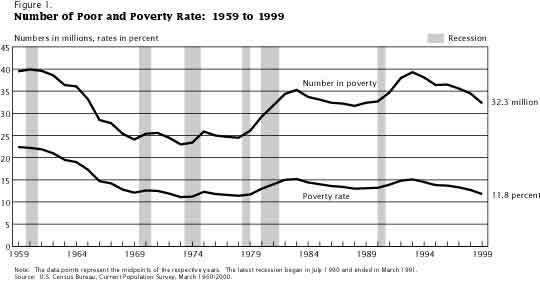
CHART: Poverty Rates |
Poverty
The poverty rate dropped from 12.7 percent in 1998 to 11.8 percent in 1999�the lowest poverty
rate since 1979. In 1999, 32.3 million people were poor, down from 34.5 million in 1998. From
1998 to 1999, poverty rates and the number of poor declined for every racial and ethnic group.
Poverty rates have fallen below or equaled the lowest rate the Census Bureau has ever measured
for each group except Whites. The poverty rate for those aged 65 and over dropped to a
measured low of 9.7 percent in 1999, while for those under age 18 the rate dropped to 16.9
percent�the lowest child poverty rate since 1979. |
Previous
12.7
1998
percent
|
Current
11.8
1999
percent
|
Provided by
U.S. Bureau of the Census
/
Current Population Survey
as of September 26, 2000.
|
CHART: Household Wealth |
Household Wealth
Median net worth was $37,587 in 1993. Differences by age group and race were significant. |
Previous
$38,500
1991
in 1993 dollars
|
Current
$37,587
1993
|
Provided by
U.S. Bureau of the Census
/
Survey of Income and Program Participation
as of September 25, 1995.
|
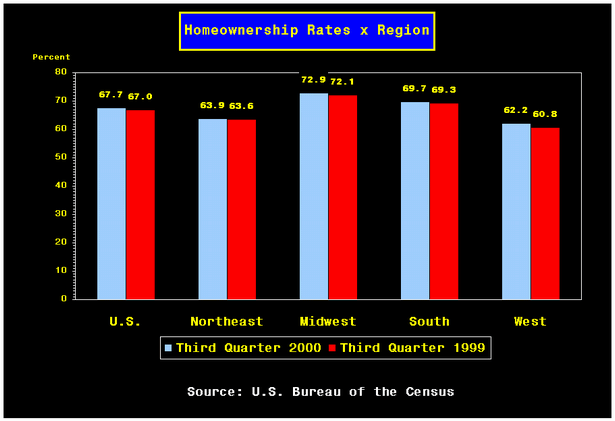
CHART: Homeownership Chart |
Homeownership
The homeownership rate in the third quarter 2000 (67.7 percent) was higher than the third quarter 1999 rate (67.0).
The homeownership rate in the West showed an increase from a year ago, while rates in
the other regions did not change significantly. |
Previous
67.0
3rd Qtr 1999
percent
|
Current
67.7
3rd Qtr 2000
percent
|
Provided by
U.S. Bureau of the Census
/
Current Population Survey
/
Housing Vacancy Survey
as of October 26, 2000.
|
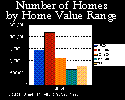
CHART: Housing Characteristics |
What's Your House Worth?
Housing values in the U.S. (and much more) |
Previous
$92,507
1995
|
Current
$98,815
1997
|
Provided by
U.S. Bureau of the Census
/
American Housing Survey
as of March 8, 2000.
|
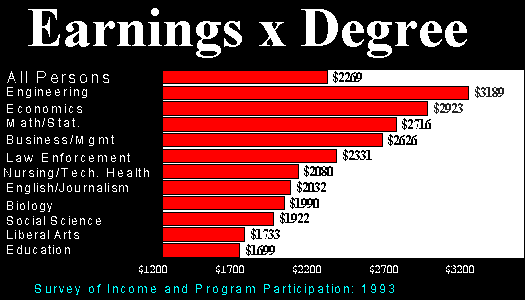
CHART: Earnings by Degree |
Earnings and Field of Degree
Monthly earnings of persons by their field of training varies greatly. The average monthly earnings for persons with B.S. degrees was $2,269 in 1993. |
Previous
$2,116
1990
|
Current
$2,269
1993
|
Provided by
U.S. Bureau of the Census
/
Survey of Income and Program Participation
as of February 29, 1996.
|